Marathon Petroleum Prices Are Correcting Lower
Let's take another look at the charts and indicators.
You've reached your free article limit
You've read 0 of 1 free Pro articles.
Marathon Petroleum Corp MPC is an integrated, downstream energy company that operates the nation's largest refining system.
The last time I reviewed MPC was November 3 where I recommended that "... $186 and the round number of $200 are my price targets for now."
Let's check the charts again.
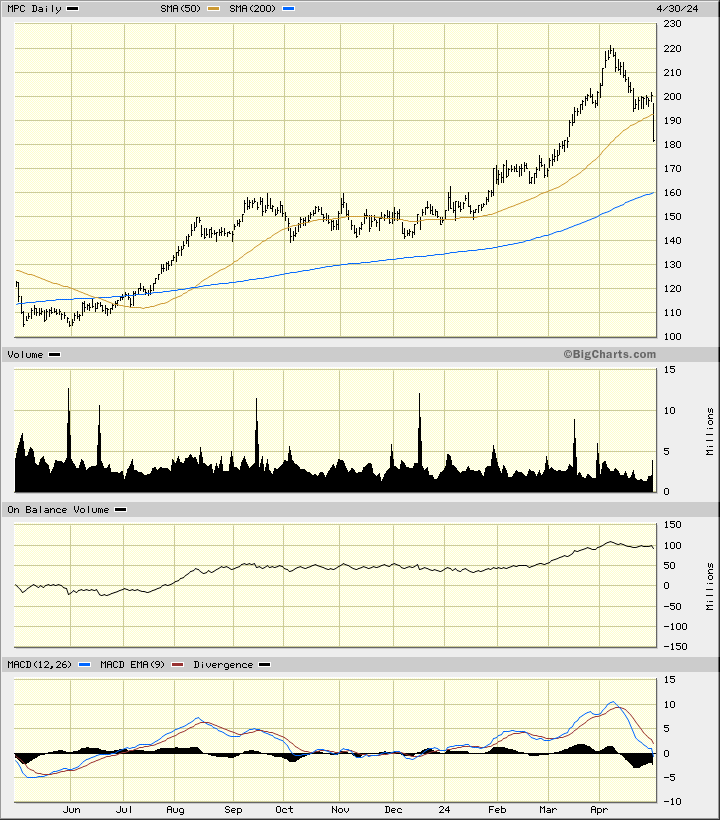
In this daily bar chart of MPC, below, prices traded sideways from August to December and then turned higher as we entered 2024. Prices climbed to our $186 Point and Figure target and overshot our $200 objective. MPC reversed direction in early April and has fallen below the 50-day moving average line whose slope has crested.
The On-Balance-Volume (OBV) line has softened in April telling me that traders have shifted from being aggressive buyers to aggressive sellers. The Moving Average Convergence Divergence (MACD) oscillator has been correcting lower and is approaching the zero line.
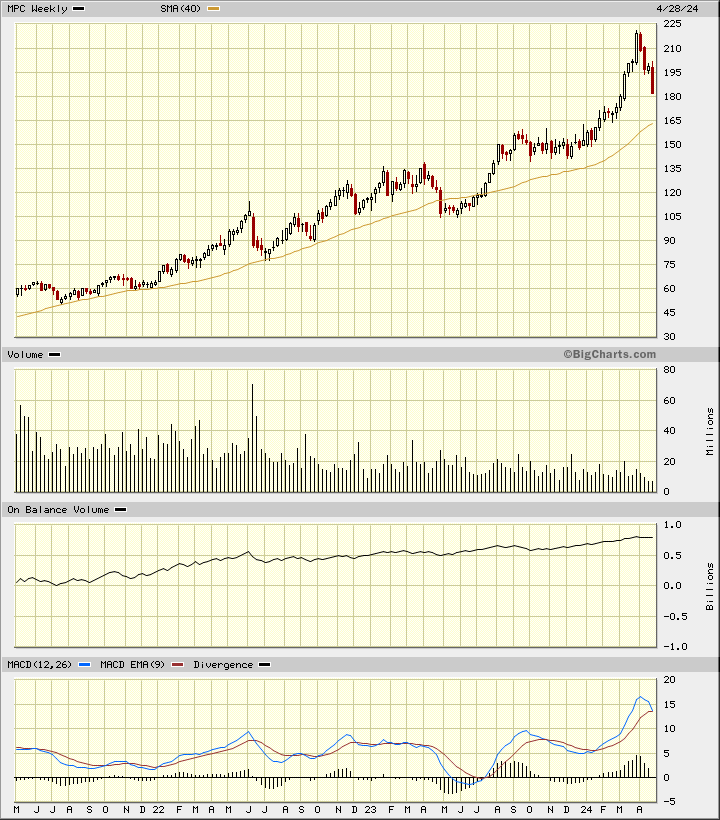
In this weekly Japanese candlestick chart of MPC, below, I can see that prices are pulling back towards the rising 40-week moving average line after getting extended (overbought) above it.
The weekly OBV line remains in a longer-term rising trend and is bullish. The MACD oscillator is close to a downside crossover and take profits sell signal.
A retest of the 40-week moving average line and chart support in the $150 area could play out in the weeks ahead.
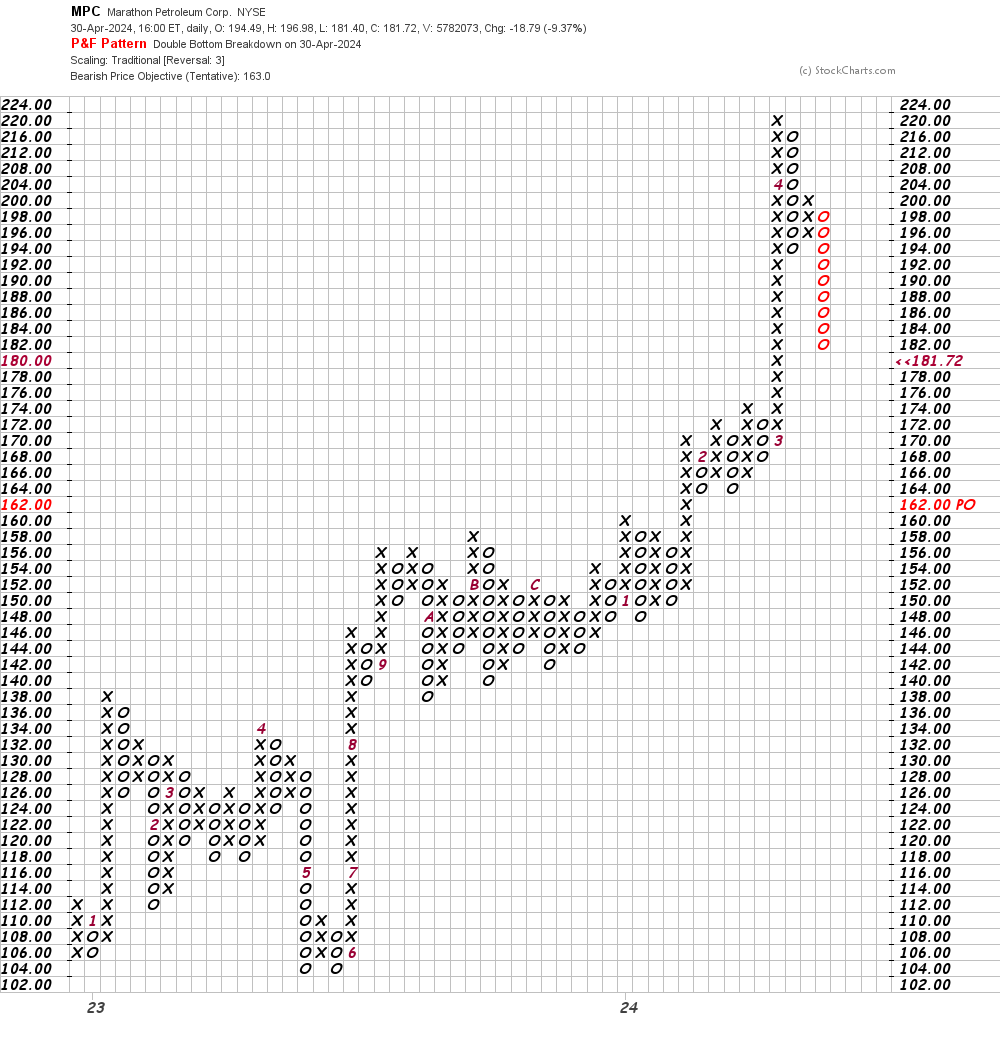
In this daily Point and Figure chart of MPC, below, I can see a potential downside price target in the $163 area.
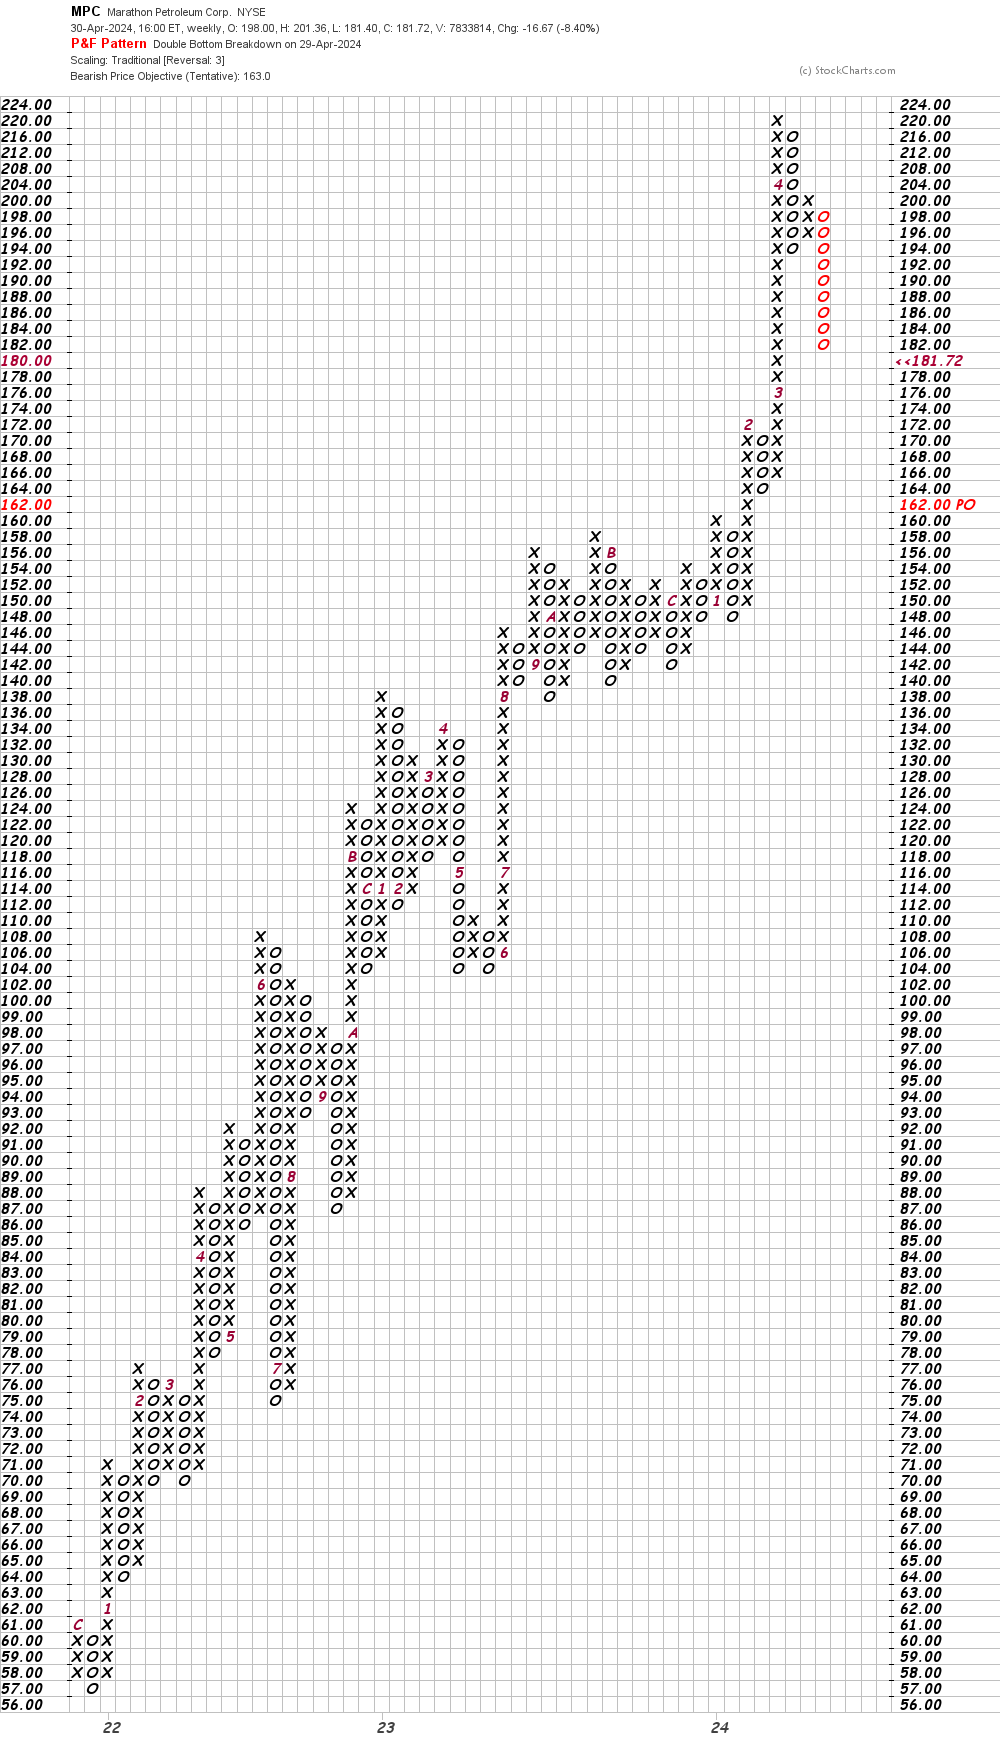
In this weekly Point and Figure chart of MPC, below, I can see the same $163 price target as shown on the daily chart above.
Bottom line strategy: I hope readers of TheStreet PRO acted by nailing down profits on a scale up to around $200. Prices are now correcting lower and that could extend through May.
Employees of TheStreet are prohibited from trading individual securities.